

In this article, we would like to consume AWS cloud watch agent running on the Ec2 instance hosting Java application to monitor JMX Exporter parameters. AWS Cloudwatch monitors AWS resources and applications running on AWS in real-time.
Prerequisites:
- A Java application running on Apache Tomcat.
- CloudWatch Agent is installed on the application server.
Step1: Configure JMX Exporter.
- Download JMX Exporter. Use the following command.
sudo wget https://repo1.maven.org/maven2/io/prometheus/jmx/jmx_prometheus_javaagent/0.16.1/jmx_prometheus_javaagent-0.16.1.jar
- Create a config.yaml file which is the configuration file of JMX Exporter.
- Copy the following code in config.yaml file.
startDelaySeconds: 0
ssl : false
lowercaseOutputName: true
lowercaseOutputLabelNames: false
- Open the Tomcat Service file
sudo vi /etc/systemd/system/tomcat.service
- Set the value of CATALINA_OPTS environment variable.
Environment="CATALINA_OPTS=-javaagent:home/ubuntu/jmx_prometheus_javaagent-0.16.1.jar=8083:/home/ubuntu/config.yaml"
- Restart Apache Tomcat.
sudo systemctl reload-daemon
sudo systemctl restart tomcat
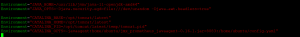
- Verify that Prometheus metrics are emitted on port 8083.
http://your-server-public-ip:8083
Step 2: Configure the CloudWatch agent to scrape Prometheus metrics
- Go to the following directory to set up the Prometheus scrape configuration.
cd /opt/aws/amazon-cloudwatch-agent/var
- Create a file prometheus.yaml and copy the following code there.
global:
scrape_interval: 1m
scrape_timeout: 10s
scrape_configs:
- job_name: jmx
sample_limit: 10000
ec2_sd_configs:
- region: us-east-2
port: 8083
filters:
- name: instance-id
values:
- i-0075da5e713e88fd9
- Now create a configuration file cwagent-config.json for CloudWatch Agent and copy the following code there.
{
"agent": {
"region": "us-east-1"
},
"logs": {
"metrics_collected": {
"prometheus": {
"cluster_name": "my-cluster",
"log_group_name": "prometheus-test",
"prometheus_config_path": "path-to-Prometheus-Scrape-Configuration-file",
"emf_processor": {
"metric_declaration_dedup": true,
"metric_namespace": "PrometheusTest",
"metric_unit":{
"jvm_threads_current": "Count",
"jvm_classes_loaded": "Count",
"java_lang_operatingsystem_freephysicalmemorysize": "Bytes",
"catalina_manager_activesessions": "Count",
"jvm_gc_collection_seconds_sum": "Seconds",
"catalina_globalrequestprocessor_bytesreceived": "Bytes",
"jvm_memory_bytes_used": "Bytes",
"jvm_memory_pool_bytes_used": "Bytes"
},
"metric_declaration": [
{
"source_labels": ["job"],
"label_matcher": "^jmx$",
"dimensions": [["instance"]],
"metric_selectors": [
"^jvm_threads_current$",
"^jvm_classes_loaded$",
"^java_lang_operatingsystem_freephysicalmemorysize$",
"^catalina_manager_activesessions$",
"^jvm_gc_collection_seconds_sum$",
"^catalina_globalrequestprocessor_bytesreceived$"
]
},
{
"source_labels": ["job"],
"label_matcher": "^jmx$",
"dimensions": [["area"]],
"metric_selectors": [
"^jvm_memory_bytes_used$"
]
},
{
"source_labels": ["job"],
"label_matcher": "^jmx$",
"dimensions": [["pool"]],
"metric_selectors": [
"^jvm_memory_pool_bytes_used$"
]
}
]
}
}
},
"force_flush_interval": 5
}
}
- Restart CloudWatch Agent with following command.
sudo /opt/aws/amazon-cloudwatch-agent/bin/amazon-cloudwatch-agent-ctl -a fetch-config -m ec2 -s -c file:/opt/aws/amazon-cloudwatch-agent/var/cwagent-config.json
Step4: Monitor Metrics and Logs of Java application
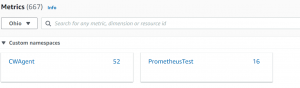
- Go to CloudWatch Console.
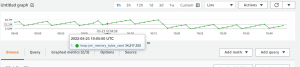
- Go to Metrics. Select the PrometheusTest Namespace to see metrics.
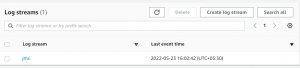
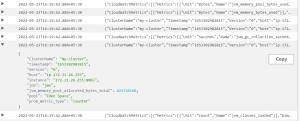
- Go to Logs->Log groups->jmx.
- Select prometheus-test to see log events.
Call us to get more information about cloud infrastructure engineering, IT Staffing Services in India, Hire Software Developers in India, and cloud operations support services in India. You can opt for our Virtual CTO Services to manage entire infrastructure tech stack.
