

New Relic One is a Software as a Service (SaaS) platform used for monitoring web, mobile applications, API calls, and infrastructure in real-time. We can monitor metrics, logs, events, and transactions through pre-built and custom dashboards and create alert policies. New Relic provides real-time alerts and anomaly detection so that the DevOps engineering team can ensure the smooth running of application and infrastructure.
Here we will be monitoring a Java Application running in a docker container. For that first, we need to create an account on New Relic One. After that follow these steps:
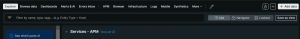
Step1: Login to your New Relic account.
- Click On Add Data in the top right corner.
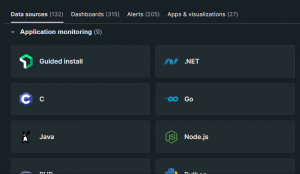
- Select your application language.
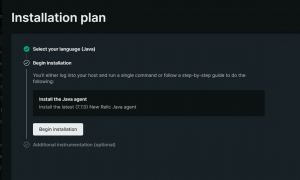
- Click on Begin Installation.
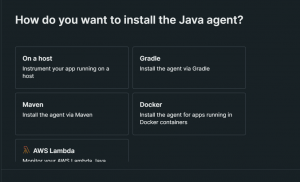
- Select On a host->Other Java Installation Options.
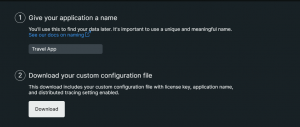
- Give a name to your application and download the configuration file.
Step2: Connect to the host in which your application is running.
- Create the following directories.
mkdir newrelic
mkdir logs
- Download the New Relic Java Agent.
curl -O https://download.newrelic.com/newrelic/java-agent/newrelic-agent/current/newrelic-java.zip
- Unzip and copy the files to the newrelic directory that we just created.
unzip newrelic-java.zip
- Replace the
newrelic.ymlfile with the custom config file you downloaded. - The startup script or command to start our application must contain Java’s built-in argument -javaagent. We have to set this argument with JAVA_OPTS variable. We also have to copy newrelic and logs directory to our container.
docker run -it -d --tmpfs /run --tmpfs /tmp --name travelapp \

-e JAVA_OPTS="-Xms128m -Xmx320m -XX:MaxPermSize=128m -javaagent:/usr/local/tomcat/newrelic/newrelic.jar" \

-v ~/newrelic:/usr/local/tomcat/newrelic \

-v ~/logs:/usr/local/tomcat/logs \

-p 8081:8080  chkmt/travel:latest
- To monitor host infrastructure, copy this command
docker run \
-d \
--name newrelic-infra \
--network=host \
--cap-add=SYS_PTRACE \
--privileged \
--pid=host \
-v "/:/host:ro" \
-v "/var/run/docker.sock:/var/run/docker.sock" \
-e NRIA_LICENSE_KEY="Enter your license key here" \
newrelic/infrastructure:latest
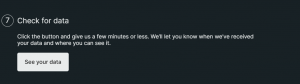
Step3: See your data.
- Click on See your data.
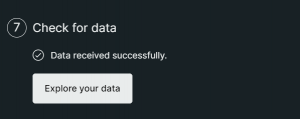
- If the connection was successful you will see the option to Explore your data, now click on it.
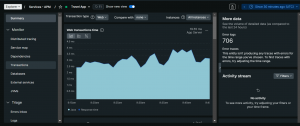
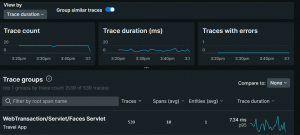
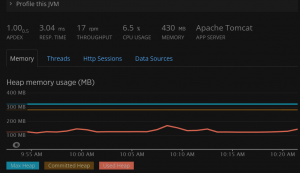
- Next, you will see a dashboard like this. You can see on the left side different parameters that you can monitor like Distributed Tracing, Databases, Transactions, JVM, etc.
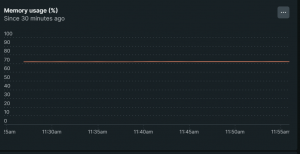
- To monitor host infrastructure click on Explorer->Infrastructure->Hosts.
- Select your host.
- You can now see metrics like CPU usage, free memory, etc.
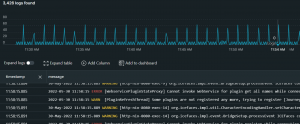
- You can also monitor logs from New Relic. Go to Logs.
Author Details
This blog is written by M/S checkmate global technologies cloud engineering team, Please write to them for seamless cloud infrastructure migration, infrastructure monitoring platform deployment.
