

Logging in Google Cloud Platform
Logging provides us information like what is the execution flow, what event is happening at what time and all the information of errors warnings if something goes, logs help us to debug the problem step by step, usually in common practice we will try to write logs related to that program flow or execution into a file or some other database so which would help us in trouble shooting , in the same way Google Cloud Platform provides Logging as a managed service and it is part of Google Cloud Operations Suite.
Cloud Logging in GCP
It provides the log information related to any service available in the google cloud platform it’s not constrained to a particular group of services, so you can keep an eye on everything that’s happening in your organization GCP account and GCP also provides you with APIs to manage logs programmatically, so basically it just lets us to View, Query and Download the logs.
Below is an example log provided for your understanding.
{
httpRequest: {1}
insertId: "6375e32e0002d2cd0d2df081"
labels: {1}
logName: "projects/rock-partition-363003/logs/appengine.googleapis.com%2Frequest_log"
operation: {4}
protoPayload: {28}
receiveTimestamp: "2022-11-17T07:30:54.185767503Z"
resource: {2}
severity: "INFO"
spanId: "8272484813176817280"
timestamp: "2022-11-17T07:30:53.051635Z"
trace: "projects/rock-partition-363003/traces/a8909f84c4f1f49a014d3a804cf4b117"
traceSampled: true
}
The basic information inside this a log entry are Time Stamp gives details of event occurrence time and date like when the event is happened related to any particular service and Resource from where that particular log information is generated for example let’s say if you are trying to access big query so that related information should have big query as a resource and detail information will be provided in Payload , payload is been removed from the above given log as a payload will have many line
In Cloud Logging logs are available in Json format, for a single log entry in order to analyze this Json file you need to manually go through the whole Json syntax, Noo, that’s a terrific task right, to help you with this GCP also allows you to export these logs to some other google cloud services like Big Query, Google Cloud Storage for further processing or analysis.
Types of audit logs in Cloud Computing
Now let’s see what the different type of audit logs are we have
Admin activity: Operations like creating, modifying or deleting a resource comes under this admin related activity, so all these related activities are captured under admin activity logs. You can also look into AWS cloudtails to find out action related every API.
Data access: Logs generated from the activities made for accessing data are captured under Data access logs, logs are generated even when data is not accessed and captured.
System event: system event means for example let’s say, you have scheduled something to happen in a specified time like a life cycle for objects stored in Cloud Storage, whenever the life cycle rules applied on the objects, logs will be generated, and these logs will be captured as System event logs. Such as Linux operating system logs would be available at /var/log/messages about every system activity.
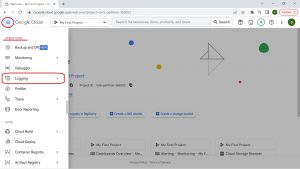
Now let’s explore how this logging interface looks like, on your GCP web console go to logging under operations,
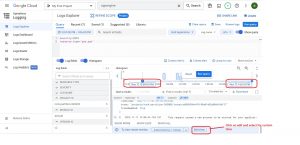
You will be landing on Logs explorer page, here you can View and Query logs, and also apply various filters and severities, just expand a log to analyze it, you can also simply share the log link to your team member to discuss on it (he/she can only see the log if the GCP account they are using has the required IAM privileges)
IAM role required for viewing a log is log.viewer .
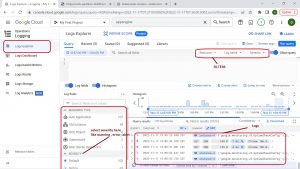
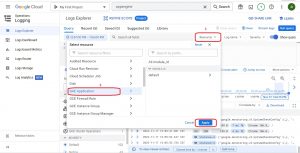
Now let’s apply some filters from the console itself and understand the auto generated queries, select a resource and the severity of the event to filter the logs. I am just selecting info logs of service Google App Engine as I do not have any errors or warnings from it.
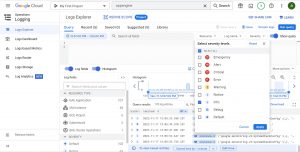
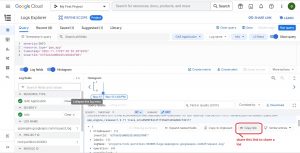
below is the auto generated query from the applied filters.
severity=INFO
resource.type="gae_app"
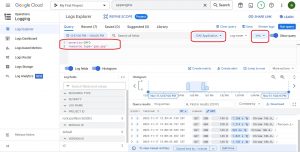
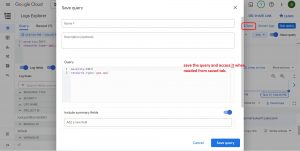
as mentioned, you can also save this query for future use by just clicking on the save button on the top right corner and you can also set the specific time frame to get the logs as shown below.
Setting the time frame, you can set the time frame from the histogram tab or by ,
This blog is written by Amit Kumar, Head of engineering at Checkmate Global Technologies. You can lease reach to him to hire Google Cloud Engineer and learn about Cloud Monitoring best practices.
