

Cloud Monitoring
Cloud Monitoring is a Google Clouds observability & infrastructure monitoring service, it provides visibility across your product development, DevOps Operations and infrastructure regardless of whether your app is running in Google cloud Platform or On-premises or in other clouds such Amazon AWS or Microsoft Azure. It automatically captures metrics and also allows you to define custom dashboards which are uniquely required for your application web traffic and business use cases and add the corresponding charts to a dashboard.
But can you sit around all day looking at your dashboards for any anomalies or usage metrics? for this cloud monitoring provides you with Alerting service, this allows you to create policies to alert on performance metrics, uptime, cpu, application element monitoring and several other things.
Cloud monitoring is simple, you can either access it on the Google cloud console or using the APIs, if you are using GKE monitoring is enabled by default for your clusters, for VM’s you should install Google Clouds monitoring Agent to get all type of metrics, for all GCP services cloud monitoring is pre-configured to automatically collect metrics.
On your Google cloud web console go-to Monitoring under operation suite.
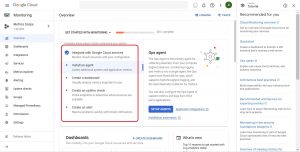
As shown in the above snapshot from GCP web console Installing Agent, Creating Custom dashboard, creating uptime check and creating an alert will give you better understanding of cloud monitoring.
Installing Cloud Monitoring Agent on Virtual Machine
Use below given link to download the agent installation script
curl -sSO https://dl.google.com/cloudagents/add-monitoring-agent-repo.sh
Add the agent’s package repository and install it
sudo bash add-monitoring-agent-repo.sh --also-install
Then Start the agent service
sudo service stackdriver-agent start
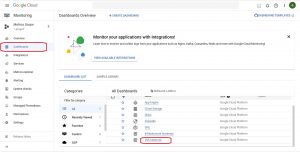
You can also install Monitoring Agent from Console; select dashboards from monitoring and I will be installing agent on Compute Engine VM’s
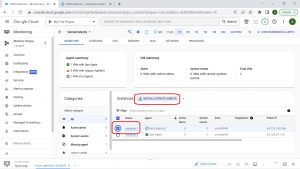
Then select the VM instance and install the agent
Creating Custom Dashboards
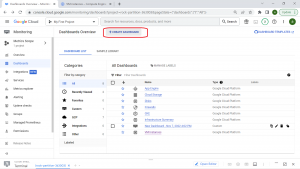
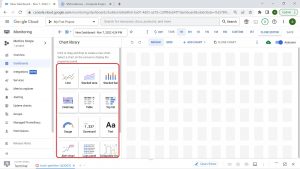
By default, Monitoring creates dashboards for each service you create in GCP, you can also create your own custom dashboards according to your requirements, let’s create custom dashboards now, follow below steps.
Then select the chart type from Chart Library and then select the resource and the particular metric that you want to monitor,
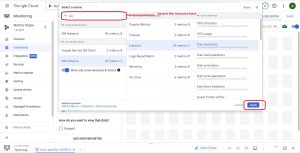
Now select the resource and metric type from the list, you can easily search for the resource/service and see the available metrics for that resource.
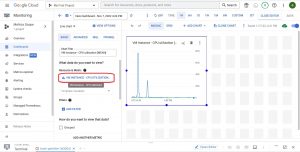
Search and select the resource and metric type from the list
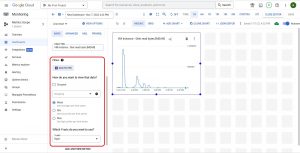
You can create and add as many charts as possible you want, and you can also filter or group the metrics from the console itself.
Author Details
This blog is written by Checkmate Global Technologies DevOps Engineer, You can contact with us to learn Google cloud best practices or for any offshore infrastructure management services website, LinkedIn
